Making location data comparable, from district to municipality
A dashboard that lets economic development agencies measure their own region against freely chosen comparison regions and pull finished reports out of it. The same figures are now also available through an API, as a widget for the agency's own website, and directly in Claude or ChatGPT. The consultancy sells the whole thing on as a product of its own.
Starting point
Assessing a location takes many indicators at once, and always in comparison: employment, skilled workers, purchasing power, commuter balance, age structure, tax revenue. The data is public, but it sits with different statistical offices, each with its own format and its own cut-off date. In raw form it helps nobody in a client meeting.
There are plenty of statistics portals, and they deliver numbers. What they do not answer is the question that actually comes up: how does my region compare with similar ones, and what do I put in front of the committee on Thursday?
Goal
A tool the agency can use on its own, without data analysis skills. Freely configurable, down to municipality level, and at the end of it a report that can be passed on without rework.
The client's corporate design was binding, down to the colour values and the house typeface, because the output reaches the end customer under their name.
Solution
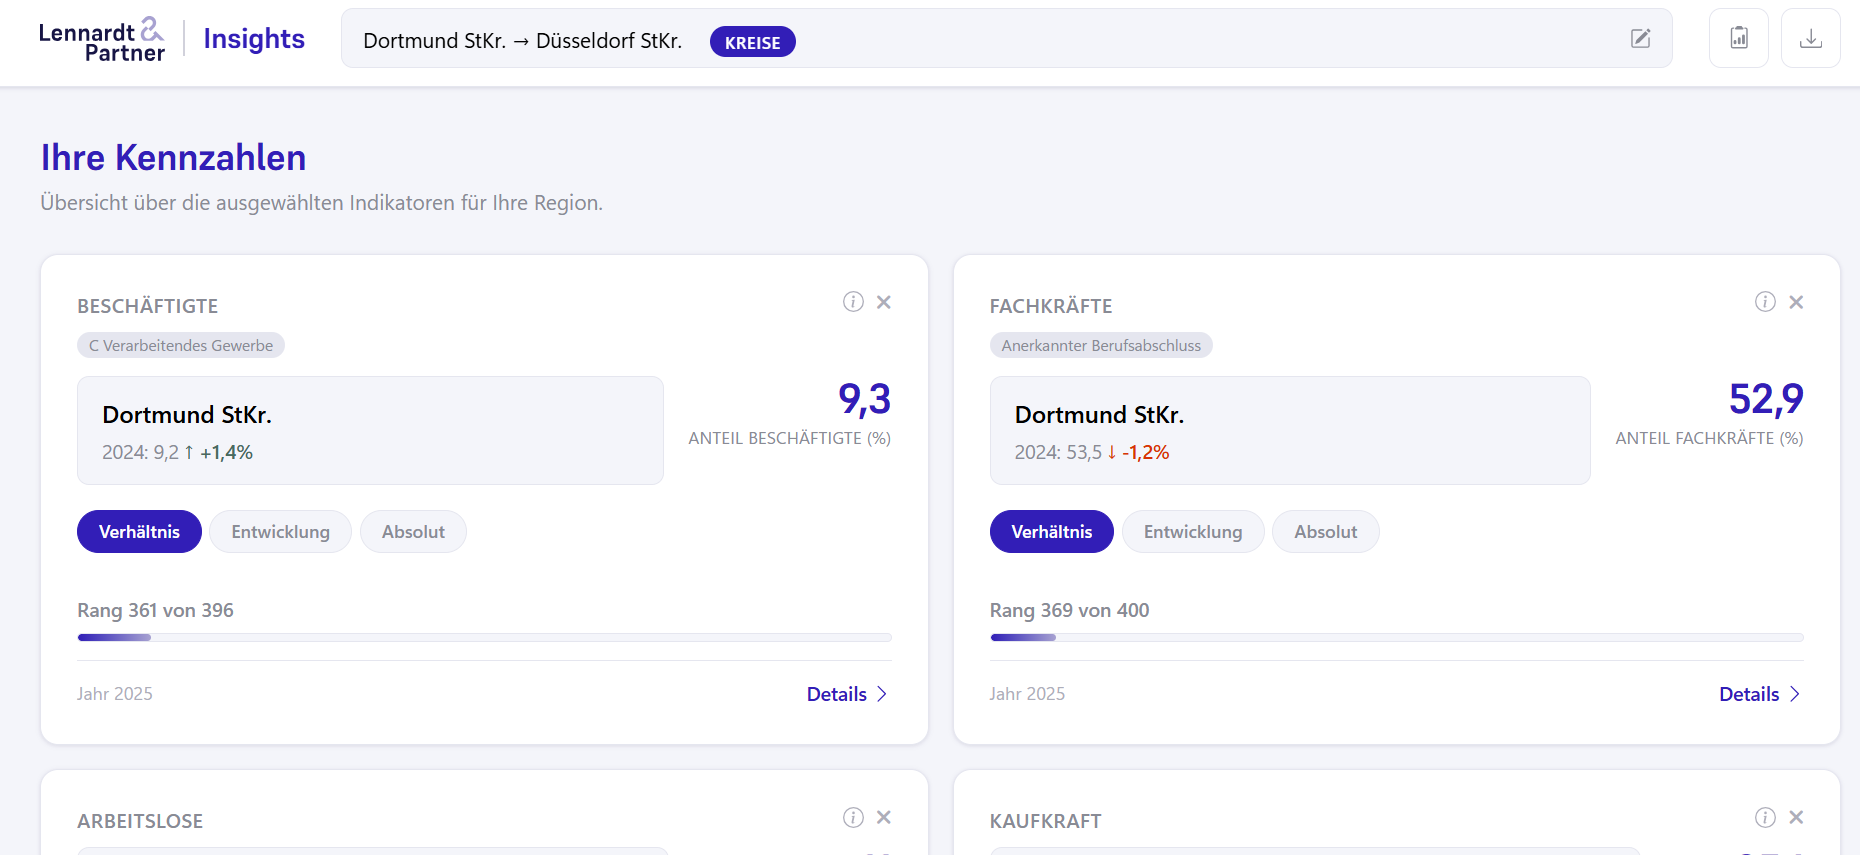
To start, you pick the level, your own region and the comparison regions. From there you assemble a board of indicator cards, drawing on 28 indicators at district level and 20 at municipality level. Each card shows your own value, at district level also the rank within the comparison set, and switches between ratio, trend and absolute figures. One click opens the map, a ten-year time series, the table and the AI assistant for that specific dataset.
At district level, all the cards feed into a weighted overall ranking where you set how heavily each indicator counts. Out comes a PDF report in the corporate design or an Excel file per indicator, and the whole setup can be saved and reloaded by the team.
Since September 2026 it works without the dashboard too. An API delivers the indicators as JSON, CSV or Parquet, along with map, time series and ranking as widgets that an agency embeds in its website with an iframe and that update with every data release. Through an MCP server, Claude, ChatGPT or Cursor query the indicators directly, using the dashboard login. Anyone who needs a public-facing location site gets an instance of their own, with the region fixed and only the features that have been switched on.
Outcome
“Stefan built us a dashboard that lets us pull up the key location data and compare it in just a few clicks. What our consulting clients value most is that staff without any data analysis knowledge can work with the tool independently. At the same time they get access to precise location insight at the smallest level. The AI support even answers questions about the results directly.”

Where it got tricky
One calculation layer for everything
First came the municipality level, with 27 times the rows and a codebase that talked about districts everywhere. Then the API, which hands the same figures to the outside world. Both times a second implementation would have been quicker to build, and both times it would have drifted apart sooner or later. Once the widget on a district's website shows a different number from the dashboard in the client meeting, nobody believes either of them. So the dashboard and the API calculate through the same functions, and special cases exist only where a ranking at municipality level makes no sense.
A board that does not lose its state
Cards come and go, the same indicator sits on the board several times with different filters, the level is switchable, and loading a saved analysis replaces the whole state at once. Every card has its own filter, display and data state, and map, plot, table, chat and ranking all hang off it. The obvious approach, keying all of that on the dataset name, holds exactly until the second card showing the same indicator.
An assistant with SQL access that cannot break anything
The assistant needs real SQL, otherwise it cannot answer the questions no card covers. That is secured several times over, independently: every indicator has its own DuckDB file opened read-only, a blocklist catches anything that is not a SELECT, and charts are produced declaratively through ggsql. No code from the model is ever executed. Database errors go back to the model on purpose so it can correct itself, while the user only sees a message that makes sense.
Technical implementation
The app is modularised with box. A dedicated script harmonises the time series onto a
fixed territorial definition up front, precomputes reference values and base years, and writes
out Parquet, which duckplyr reads lazily at runtime. Where DuckDB will not play
along, the data is materialised deliberately, and those spots are marked in the code.
PDF rendering, the combined Excel export and the assistant's replies run as an
ExtendedTask in the background via mirai. The report is built with
Quarto and Typst, which keeps TeX out of the image. Colours, fonts and logo live in one
brand.yml per customer, and the dashboard, widgets, PDF and chat charts all derive
from it.
The API runs on plumber2 on a server of its own and authenticates against the same
Cognito user pool as the dashboard. Once a widget has been rendered, it comes back from disk in
under 10 ms without R being involved. The signature on an embed URL covers every parameter:
whoever copies it gets exactly that one widget. The limit is 2,500 areas, so the API refuses a
nationwide municipality map.
The MCP server is a slim TypeScript service that calculates nothing and stores nothing. What it adds are the rules for reading the numbers, such as that a rank only means something next to its comparison set. The login took the most work: Cognito has no Dynamic Client Registration and no redirects to changing ports, which is what Claude Code opens per session. So towards the clients, the server acts as an OAuth server itself.
Hosting and ongoing work
The project started in July 2024 and is still being extended, most recently with the API, the widgets, the MCP server and public instances. Larger extensions are followed by quieter stretches where I just keep it running.
I look after hosting, data updates and the database. A push builds the images, pushes them to a private registry in the EU and rolls them out on servers in Germany. The dashboard is served through ShinyProxy with one container per session, the API and MCP server from a machine of their own. Next to the dashboard, the API would have had to move to port 8443, which some corporate networks do not let out. A widget would simply have stayed blank there.
Public instances start with every feature switched off. A forgotten setting then shows too little instead of leaving the AI assistant running on a public site. Saved analyses are never hard-deleted, only marked inactive, so a slip stays fixable.